
缘之空安卓版汉化
1435MB · 2025-12-24

在上一篇我们实现了公交线路客流,通过飞线效果展示了站点间的客流流向。现在我们来搞一下区域客流可视化,采用六边形蜂窝网格来展示不同区域的客流热力图,除了保证数据更加直观外,当然也要利用JSAPIThree高灵活自定义的优势来搞点帅的东西。
在公交行业的区域客流可视化主要的是:
与线路客流相比,区域客流更注重空间分布特征这块。我们使用六边形蜂窝网格将城市区域进行规则划分(也支持正方形、三角形),每个六边形代表一个单元,通过统计单元内的公交站点数量和客流数据,生成蜂窝热力图来直观展示每块区域的客流密度分布。
基于上一篇文章的初始化地图代码,我们需要以下数据文件(文件在下方仓库地址):
guzhen.json) - 城市或区域边界数据stands.json) - 公交站点位置和客流数据边界数据采用标准的 GeoJSON 格式(这种数据推荐去阿里的datav中可以直接获取包括省市区)。站点数据包含每个站点的经纬度坐标和客流统计信息。
六边形相对比矩形和三角形看起来更专业一点。我们使用 Turf.js 的 hexGrid 函数来生成蜂窝网格(truf也支持三角形和矩形)。
网格生成原理:
bbox 函数计算多边形的包围盒booleanIntersects 过滤与目标区域相交的六边形,也就是整个区域内的蜂窝import { bbox, polygon, hexGrid, booleanIntersects, booleanContains } from '@turf/turf'
// 生成 1.5km 六边形蜂窝并裁剪到目标边界
const hexLinesFC = () => {
const boundary = guzhen.features[0].geometry
const wgsPolygon = polygon([boundary.coordinates[0]])
const box = bbox(wgsPolygon)
// 生成 1.5公里半径的六边形网格
const grid = hexGrid(box, 1.5, { units: 'kilometers' })
// 过滤与边界之外的六边形
const features = grid.features.filter((cell) => booleanIntersects(cell, wgsPolygon))
return { type: 'FeatureCollection', features }
}
booleanIntersects 函数是空间相交判断,booleanContains函数是判断否在空间内,我们只保留与目标区域重叠的六边形
为每个六边形计算站点数量和总客流数据,这是为了生成热力图用的的数值。
统计原理:
booleanContains 函数判断站点是否在六边形内// 计算每个六边形内的站点数据
const calculateHexagonData = (hexagon) => {
let totalUp = 0 //六边形内所有站点的上车人数总和
let stationCount = 0 // 六边形内包含的站点数量
// 遍历所有站点,检查是否在六边形内
for (const station of stands) {
for (const stand of station.stands) {
const standPoint = point([stand.lon, stand.lat])
//是否在内部
if (booleanContains(hexagon, standPoint)) {
totalUp += stand.up || 0
stationCount++
}
}
}
return { totalUp, stationCount }
}
然后我们可以用使用处理好的所有数据使用mapvthree.Polyline进行预览,代码如下:
// 生成六边形蜂窝并裁剪到边界
const hexLinesFC = (): any => {
  const g = (guzhen as any)?.features?.[0]?.geometry
  if (!g) return { type: 'FeatureCollection', features: [] }
  // 使用边界外环构造 turf 多边形
  let wgsOuter: [number, number][] = []
  if (g.type === 'Polygon') {
    wgsOuter = (g.coordinates?.[0] || []) as [number, number][]
  } else if (g.type === 'MultiPolygon') {
    wgsOuter = (g.coordinates?.[0]?.[0] || []) as [number, number][]
  }
  if (!wgsOuter || wgsOuter.length < 3) return { type: 'FeatureCollection', features: [] }

  const wgsPolygon = turfPolygon([wgsOuter])
  const box = turfBbox(wgsPolygon)

  const radius = 1.5
  // 生成 5 公里六边形网格
  const grid = turfHexGrid(box, radius, { units: 'kilometers' } as any)
  // 过滤与多边形相交的六边形
  const features: any[] = []
  for (const cell of grid.features || []) {
    try {
      if (turfBooleanIntersects(cell as any, wgsPolygon as any)) {
        const ring: [number, number][] = (cell.geometry as any)?.coordinates?.[0] || []
        if (Array.isArray(ring) && ring.length > 0) {
          // 计算六边形内的站点数据
          const hexData = calculateHexagonData(cell)

          const bdCoords = ring.map(([lon, lat]) => wgs84tobd09(lon, lat))
          features.push({
            type: 'Feature',
            geometry: { type: 'LineString', coordinates: bdCoords },
            properties: {
              type: 'hex',
              radius_km: radius,
              totalUp: hexData.totalUp,
              stationCount: hexData.stationCount,
              hexagonId: features.length,
            },
          })
        }
      }
    } catch (_e) {}
  }
  return { type: 'FeatureCollection', features }
}

//传入数据
const hexSource = mapvthree.GeoJSONDataSource.fromGeoJSON(hexLinesFC() as any)
const hexLayer = engine.add(
  new mapvthree.Polyline({
    flat: true,
    lineWidth: 1.5,
    keepSize: true,
    color: '#7A7AFF',
  }),
)
hexLayer.dataSource = hexSource
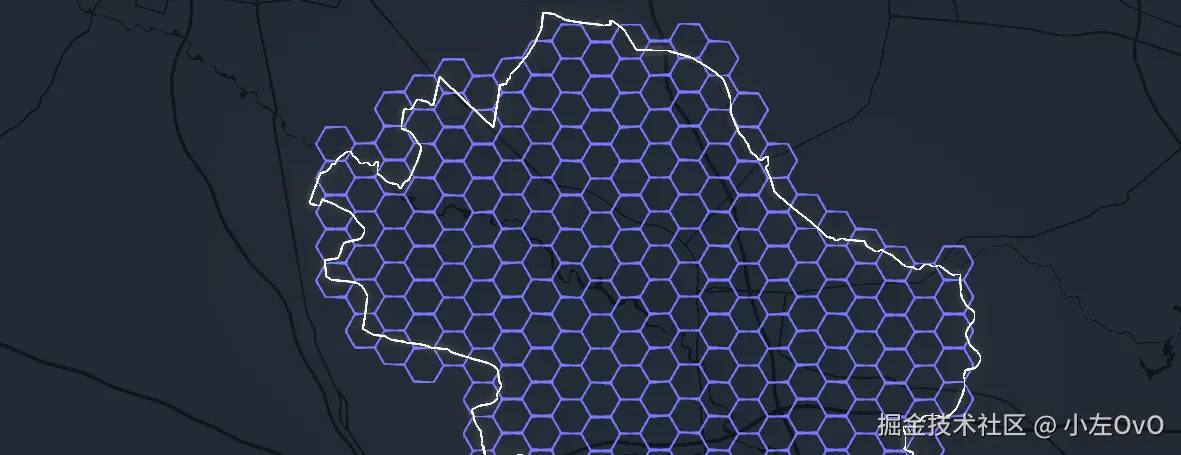
目前的基础效果就是这个样子:
现在我们要让这些六边形更加的层次分明,要用颜色和透明度来直观展示客流密度分布,让数据更可视化。我们使用 THREE.js 的 LineSegments 来绘制六边形边框,为了实现更吊的热力图效果。上面的 mapvthree 蜂窝可以暂时隐藏,专注于我们自定义效果的实现。
接着我们使用 HSL色彩空间实现根据蜂窝内的总下车人数从绿色到红色的自然过渡
const createHexagonLineSegments = () => {
    const hexData = hexLinesFC()
    const vertices = []
    const colors = []

    // 找到客流最大的六边形作为基准
    const maxTotalUp = Math.max(...hexData.features.map((f) => f.properties.totalUp))

    for (const feature of hexData.features) {
        const { totalUp, stationCount } = feature.properties
        const coords = feature.geometry.coordinates

        // 根据客流数据调色
        let heatColor = new THREE.Color()

        if (stationCount > 0) {
            const intensity = totalUp / maxTotalUp
            // 从绿色到红色渐变
            heatColor.setHSL(0.33 - intensity * 0.33, 1.0, 0.5)
        } else {
            // 没有站点的区域保持灰色
            heatColor.setHSL(0, 0, 0.3)
        }

        // 设置颜色
        for (let i = 0; i < coords.length - 1; i++) {
            const [x1, y1] = bd09ToMercator(coords[i][0], coords[i][1])
            const [x2, y2] = bd09ToMercator(coords[i + 1][0], coords[i + 1][1])

            vertices.push(x1, y1, 0, x2, y2, 0)
            colors.push(heatColor.r, heatColor.g, heatColor.b)
            colors.push(heatColor.r, heatColor.g, heatColor.b)
        }
    }

    // 创建几何体,让每条线都有颜色
    const geometry = new THREE.BufferGeometry()
    geometry.setAttribute('position', new THREE.Float32BufferAttribute(vertices, 3))
    geometry.setAttribute('color', new THREE.Float32BufferAttribute(colors, 3))

    const material = new THREE.LineBasicMaterial({
        vertexColors: true,
        transparent: true,
        opacity: 0.8,
    })

    return new THREE.LineSegments(geometry, material)
}
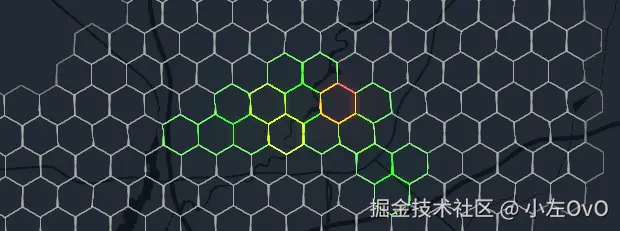
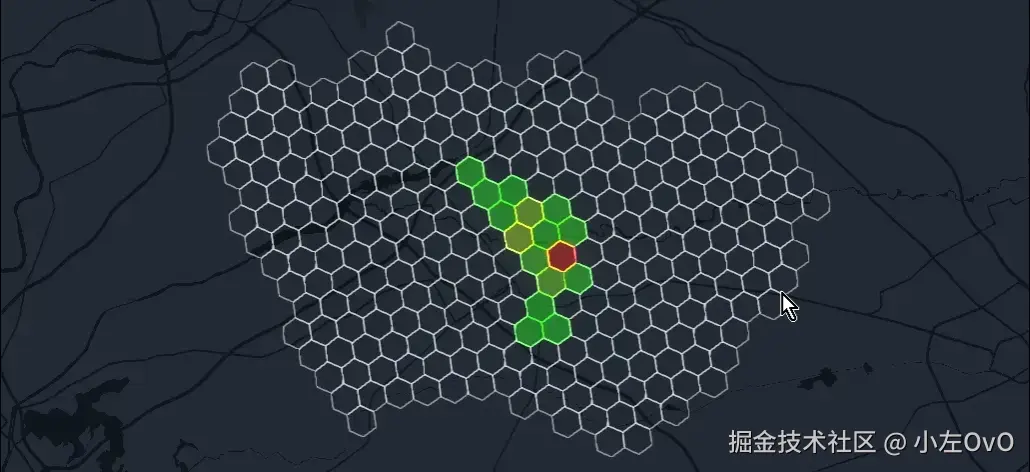
好的,上色之后我们可以很直观的看到哪里的客流多:
光有边框还不够,我们再来给热力图填充颜色。半透明的填充让整个热力图数据效果看起来更加直观,视觉层次也更丰富。
const createHexagonFillPolygons = () => {
  const hexData = hexLinesFC()
  const polygons = []

  for (const feature of hexData.features) {
    const { totalUp, stationCount } = feature.properties
    const coords = feature.geometry.coordinates


    if (stationCount === 0) continue

    // 填充着色
    const intensity = totalUp / maxTotalUp
    const heatColor = new THREE.Color()
    heatColor.setHSL(0.33 - intensity * 0.33, 1.0, 0.5)

    // 创建三角形面片
    const vertices = []
    const center = calculateCenter(coords)

    for (let i = 0; i < coords.length - 1; i++) {
      const [x1, y1] = bd09ToMercator(coords[i][0], coords[i][1])
      const [x2, y2] = bd09ToMercator(coords[i + 1][0], coords[i + 1][1])

      vertices.push(center.x, center.y, 0, x1, y1, 0, x2, y2, 0)
    }

    const geometry = new THREE.BufferGeometry()
    geometry.setAttribute('position', new THREE.Float32BufferAttribute(vertices, 3))

    const material = new THREE.MeshBasicMaterial({
      color: heatColor,
      transparent: true,
      opacity: 0.2,
      side: THREE.DoubleSide,
    })

    polygons.push(new THREE.Mesh(geometry, material))
  }

  return polygons
}
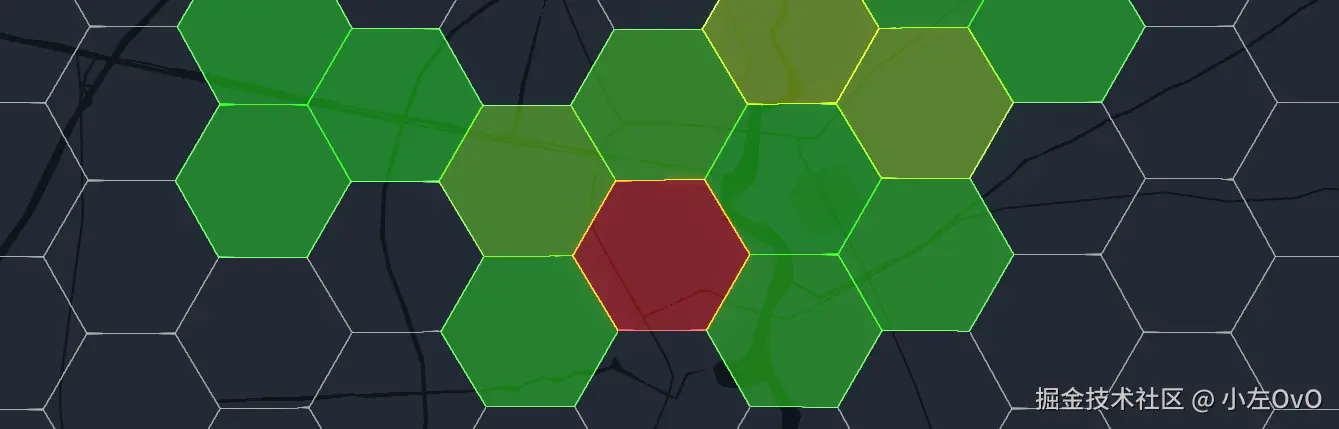
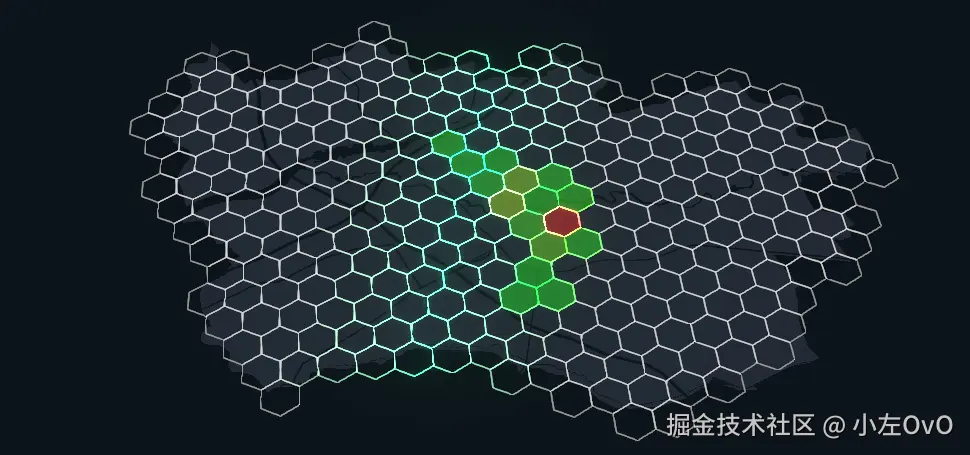
这样,我们的热力图就有了底层边框和内部填充:
看起来蛮吊的,还能不能更唬人一点
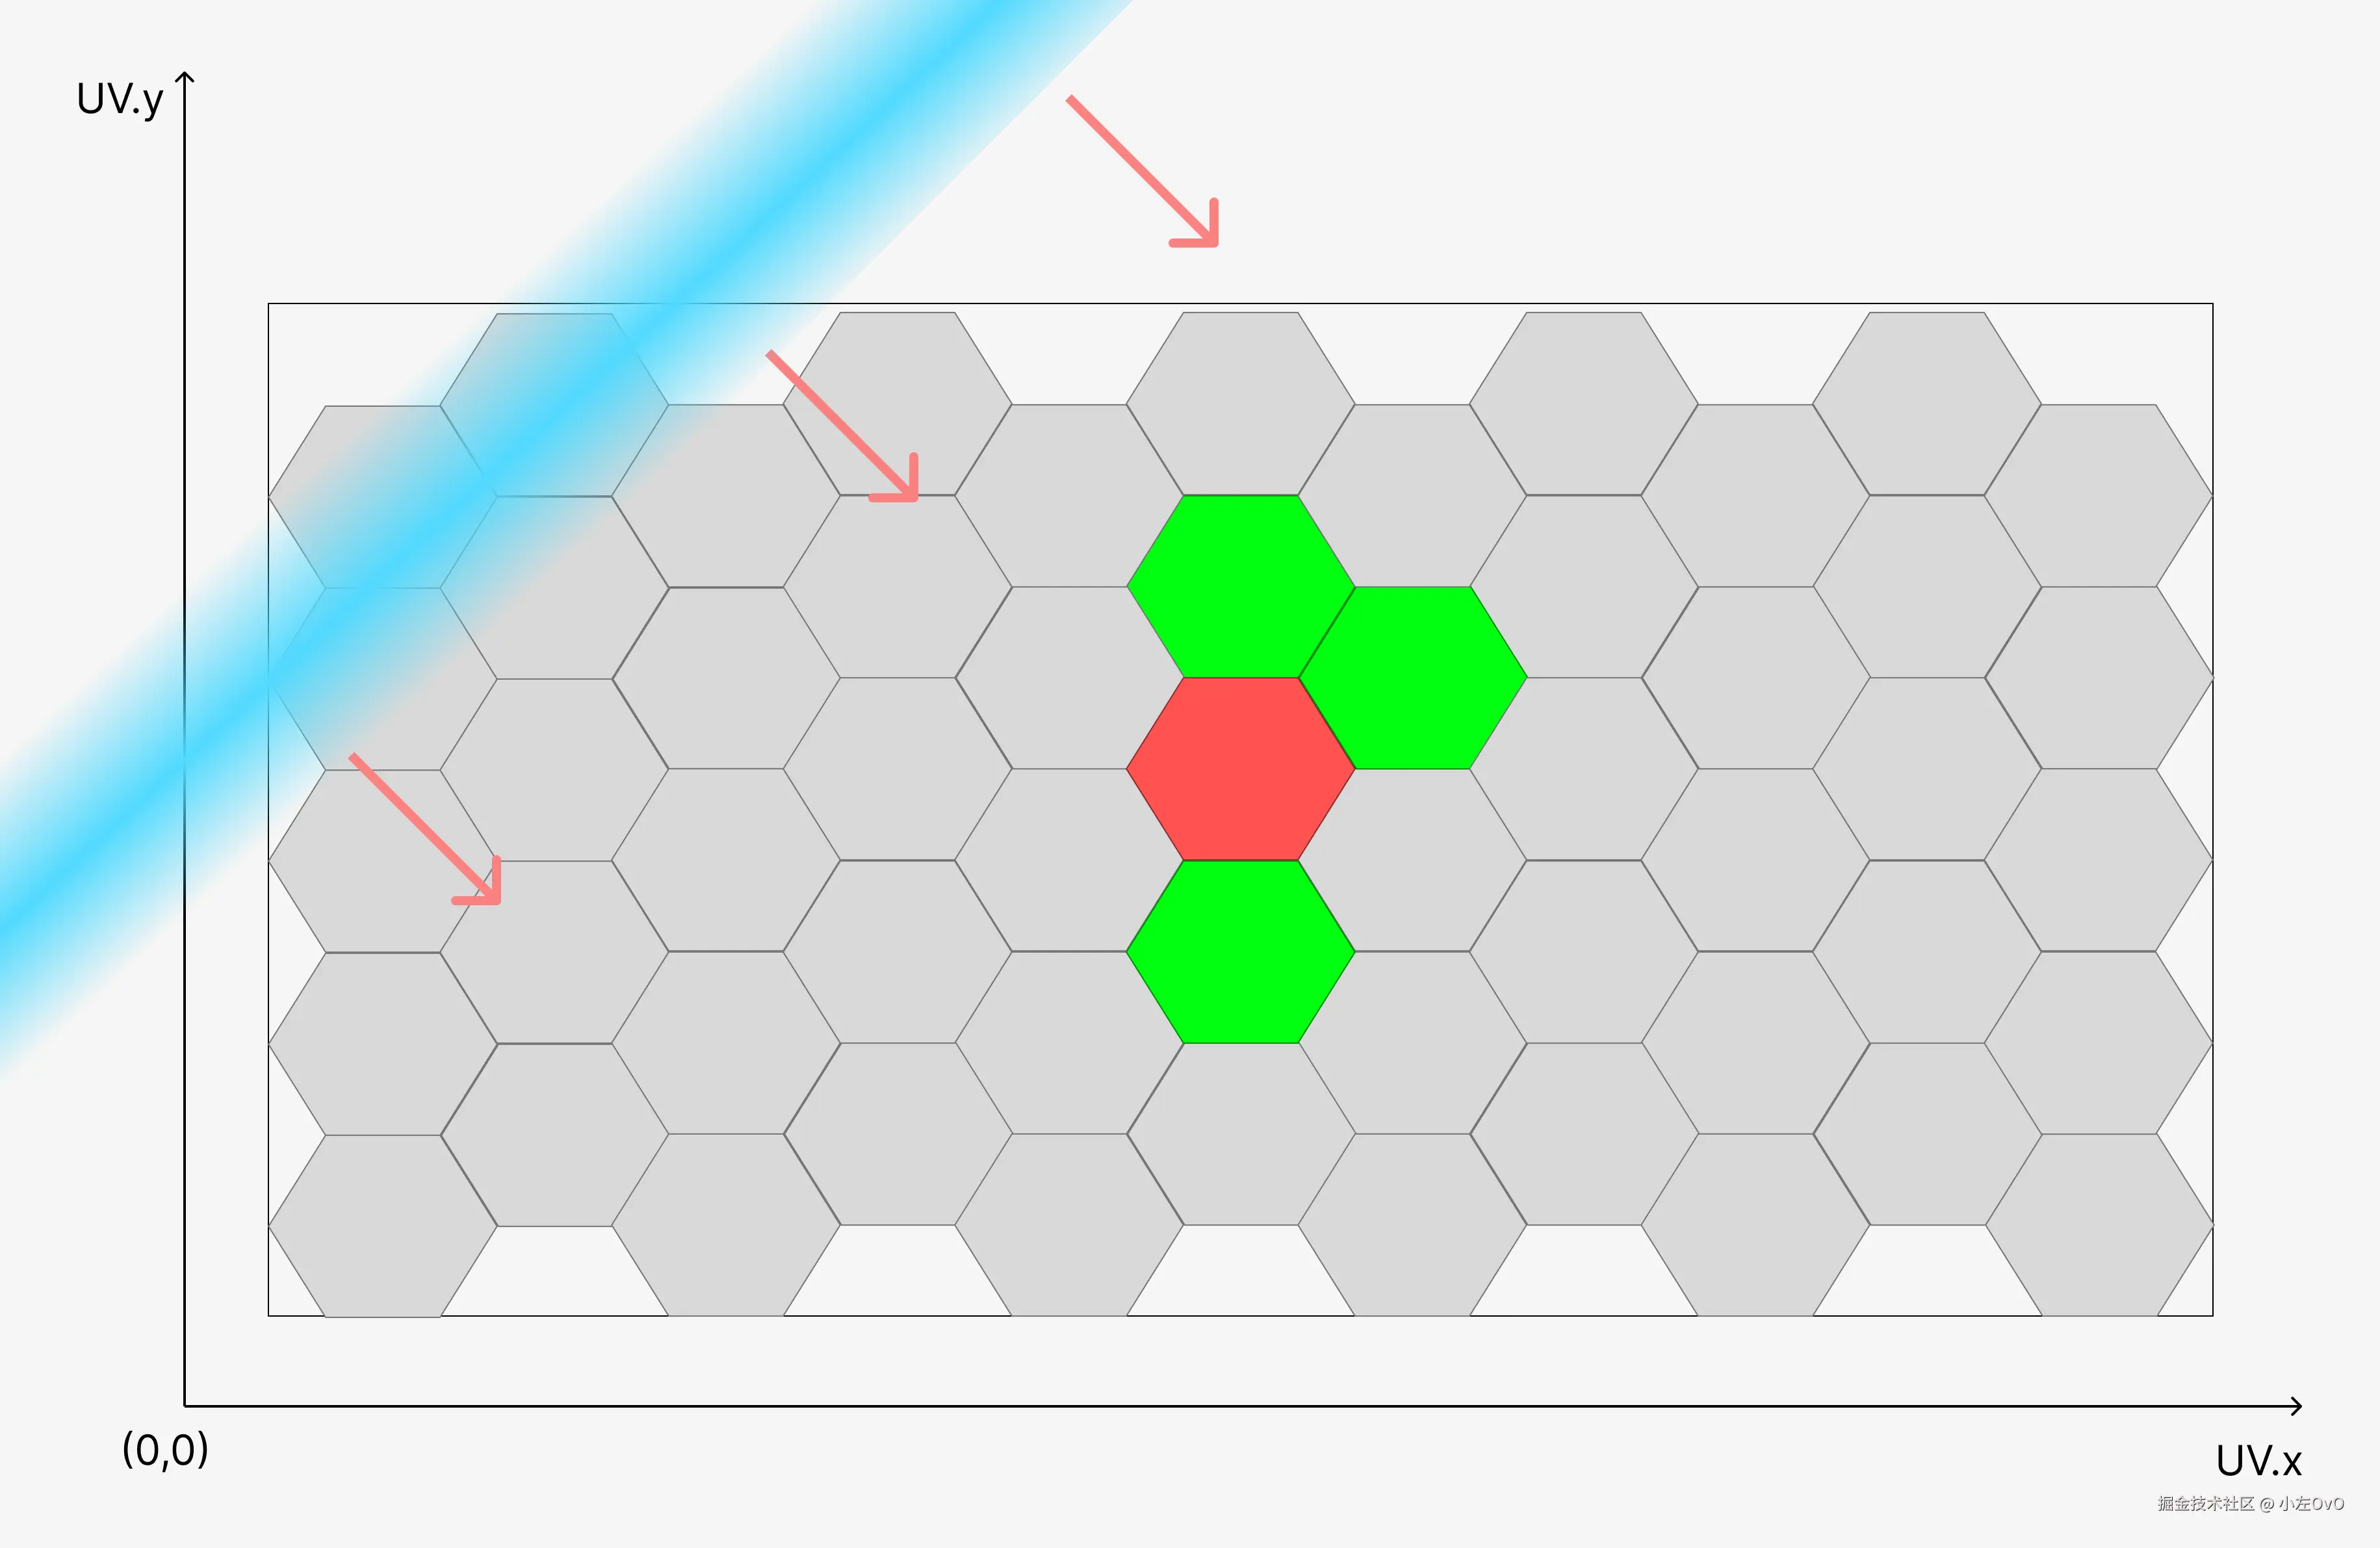
扫描效果还是非常适合这种网格的面,采用从左上到右下的渐变矩形扫光 大致效果如图所示:
const createSweepShaderMaterial = () => {
    return new THREE.ShaderMaterial({
        uniforms: {
            time: { value: 0.0 },
            sweepColor: { value: new THREE.Color(0x00ffa8) },
            sweepSpeed: { value: 0.5 },
        },
        vertexShader: `
      attribute vec3 color;
      varying vec3 vColor;
      varying vec2 vUv;

      void main() {
        vColor = color;
        vUv = position.xy;
        gl_Position = projectionMatrix * modelViewMatrix * vec4(position, 1.0);
      }
    `,
        fragmentShader: `
      uniform float time;
      uniform vec3 sweepColor;
      uniform float sweepSpeed;
      varying vec3 vColor;
      varying vec2 vUv;

      void main() {
        uniform float time;
                uniform vec3 sweepColor;
                uniform float sweepWidth;
                uniform float sweepSpeed;
                uniform float glowIntensity;

                varying vec2 vUv;
                varying vec3 vColor;
                varying float vOpacity;

                void main() {
                    float sweepPos = mod(time * sweepSpeed, 2.0);
                  float diagonalDist = (vUv.x + (1.0 - vUv.y)) * 0.5;
                  float dist = abs(diagonalDist - sweepPos);

                  // 光衰减和柔尾
                  float gradient = 1.0 - smoothstep(0.0, sweepWidth, dist);
                  float softGlow = exp(-dist / (sweepWidth * 0.3));
                  float sweep = mix(gradient, softGlow, 0.5);

                  // 脉冲
                  sweep *= 0.7 + 0.3 * sin(time * 8.0);
                  sweep = clamp(sweep, 0.0, 1.0);

                  // 混色 和 发光
                  vec3 finalColor = mix(vColor, sweepColor, sweep);
                  finalColor += sweepColor * sweep * glowIntensity;

                  // bloom 触发
                  finalColor *= 10.0;

                gl_FragColor = vec4(finalColor, vOpacity);
                      }
                    `,
        transparent: true,
        blending: THREE.AdditiveBlending,
    })
}
扫光效果就出来了,看起来很科幻,这领导看不得拍手叫好?
为了突出更加沉浸的显示目标区域,我们创建一个黑色掩膜来遮挡区域外的内容,让观众的注意力集中在目标区域。
实现的步骤:
// 创建区域掩膜
const buildMaskFC = () => {
  const boundary = guzhen.features[0].geometry

  // 世界矩形
  const worldRect = [
    [-180, -85],
    [180, -85],
    [180, 85],
    [-180, 85],
    [-180, -85],
  ]

  // 目标区域作为洞
  const hole = boundary.coordinates[0].map(([lon, lat]) => wgs84tobd09(lon, lat))

  return {
    type: 'Feature',
    geometry: {
      type: 'Polygon',
      coordinates: [worldRect, hole], // 外环 + 内环
    },
  }
}

const maskLayer = engine.add(
  new mapvthree.Polygon({
    flat: true,
    color: '#0D161C',
    opacity: 1,
  }),
)
maskLayer.dataSource = mapvthree.GeoJSONDataSource.fromGeoJSON(buildMaskFC())
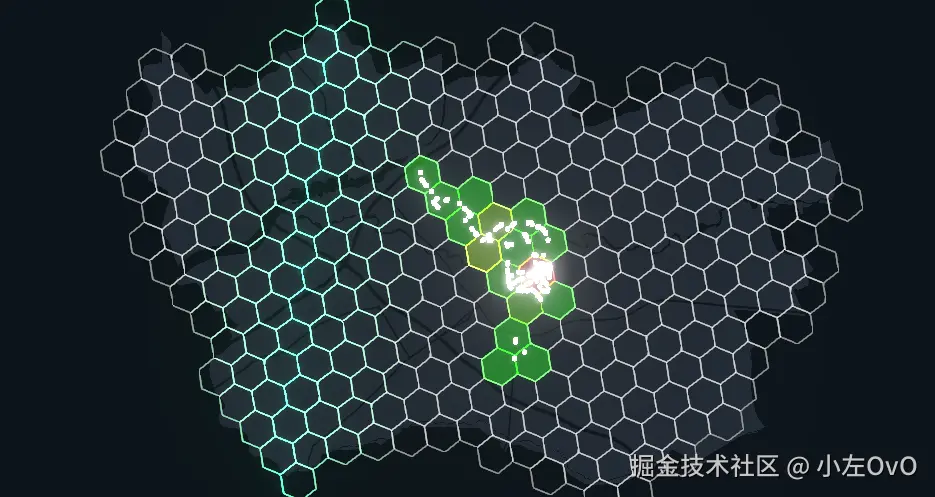
效果如图,会更专注聚焦这个区域
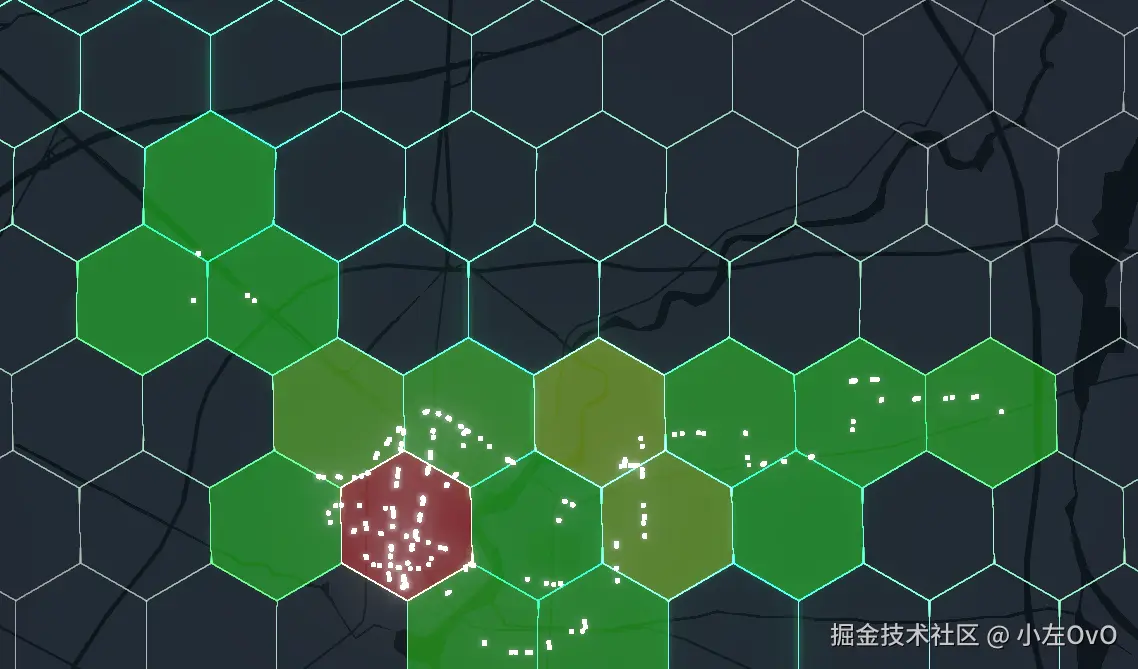
最后为所有公交站点添加发光粒子效果,能够清晰的看到站点分布在蜂窝的情况,我们使用threejs的粒子Points,并让他发光以增强效果,首先将Point位置投影到站点实际的位置 然后使用canvas为粒子创建纹理材质,最后增加亮度触发Bloom即可~
const createStationParticles = () => {
  const positions = []

  // 收集坐标
  for (const station of stands) {
    for (const stand of station.stands) {
      const [x, y] = bd09ToMercator(
        wgs84tobd09(stand.lon, stand.lat)[0],
        wgs84tobd09(stand.lon, stand.lat)[1],
      )
      positions.push(x, y, 0)
    }
  }

  // 创建粒子
  const geometry = new THREE.BufferGeometry()
  geometry.setAttribute('position', new THREE.Float32BufferAttribute(positions, 3))

  // 创建纹理
  const texture = createCircleTexture(64, '#ffffff')

  // 创建发光材质
  const material = new THREE.PointsMaterial({
    size: 5,
    map: texture,
    transparent: true,
    blending: THREE.AdditiveBlending,
  })

  // 触发泛光
  material.color.setRGB(4, 4, 4)

  return new THREE.Points(geometry, material)
}

// 生成纹理
const createCircleTexture = (size, color) => {
  const canvas = document.createElement('canvas')
  canvas.width = canvas.height = size
  const ctx = canvas.getContext('2d')

  ctx.fillStyle = color
  ctx.beginPath()
  ctx.arc(size / 2, size / 2, size / 2, 0, Math.PI * 2)
  ctx.fill()

  return new THREE.CanvasTexture(canvas)
}
主要的实现还是靠turf,turf真是对数学不好的开发的一种福音啊,好用爱用, 拿到边界数据使用bbox计算出边界,然后在这个包围盒通过turfHexGrid生成Hexagon蜂窝,最后用booleanContains裁剪掉地区边界外的蜂窝。
先将客流的数据都维持在0-1之间,这里也叫数据归一化,然后更具数值为设置HSL颜色也就是类似css的rab(255,255,255) 这种写法。
shader glsl不像js那样可以打印调试,完全靠抽象的脑补,这里主要的步骤: 位置计算 → 距离场 → 光脉冲 → 合成
区域客流可视化通过六边形蜂窝网格和热力效果,除了能把复杂的空间数据转化为直观的视效,还结合扫光动画和粒子效果增加视觉体验。
下一篇我们将继续实现实时公交